“When the going gets tough, the tough buy Nestlé.”
Rules would certainly make any investor’s life easier but, in the realm of WallStreet, the only rule that has stood the test of time has been ‘no-goddamn-rule’.
However, the above statement comes with asterisks. The Stock Market may not have dependable destinations but it does have bearings and investors certainly know their ‘North’ i.e. profits. One such bearing is the Price-to-earnings (PE) ratio. And if you as an investor calibrate your stock investment journey with this compass, you sure are likely to have a smooth sail.
What is PE ratio and what makes it a big deal?
Though far from wholly dependable and pre-calculated bulls’-eyeshot, PE ratio has delivered near favorable results on most occasions.
Investors use the PE ratio to understand if a stock is performing on an investment basis or a speculative basis.
It is a metric to gauge the attractiveness of a company’s stock price. In accounting terms, a PE ratio is the price investor is paying for USD 1 profit earned by the company. Here’s the formula:

This is done in two ways. By calculating:
Trailing PE, which is estimated from Earnings per share (EPS) from the last four quarters/
Forward PE, which is calculated by EPS for the coming four quarters.
Example:
Consider the 2017 year-end data for two stock prices of JP Morgan Chase and the Bank of America
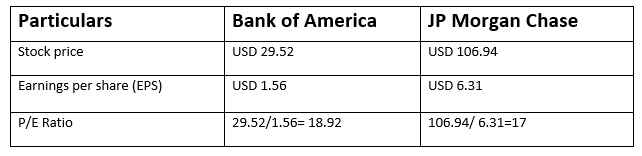
Bank of America with an approximate PE ratio of 19 has a higher probability of earnings growth than JPMorgan Chase with a PE ratio of 17.
The difference in PE arises because of the gap between the companies’ growth rate and return on equity.
Before you zero in on PE ratio:
Take PE ratio with a grain of salt and do your bit of research before jumping to the final choice. Here are a few more pointers to help you arrive at the decision:
- PE ratio of a company could be high because investors have a bullish sentiment about it or it could have high growth prospects.
- If you are going for dividend investing, then check the dividend rate. You may also want to check out the company’s sales figures, earning charts and other details.
- Be careful while comparing stocks from different industries. It wouldn’t be wise to compare the PE ratio of a manufacturing company with that of a Tech company.
- A scan of the historical averages will indicate if the sector or industry is overpriced.
- To make a more informed decision, ask for a prospectus or conduct a detailed online search about the company. A prospectus is a legal document and contains all necessary information about the mutual fund, stock or bonds.
- For more refined results, check the PEG ratio which takes into account the growth rate.

Sum up:
If you are looking to buy a stock, then one with a lower PE ratio could indicate undervalued stocks.
As a general rule, any PE number that falls between zero to ten isn’t worth considering.
High-values propositions are volatile. If the number is as high as 25 then the company is likely to see cash-rich days in the future. At the same time, this could also indicate a fully-developed bubble that could burst at any point. Any number that falls between 10 to 17 could indicate a safe bet.
PE ratio must not be treated as the ultimate yardstick. It must only be taken as an indicator of the company’s growth potential.
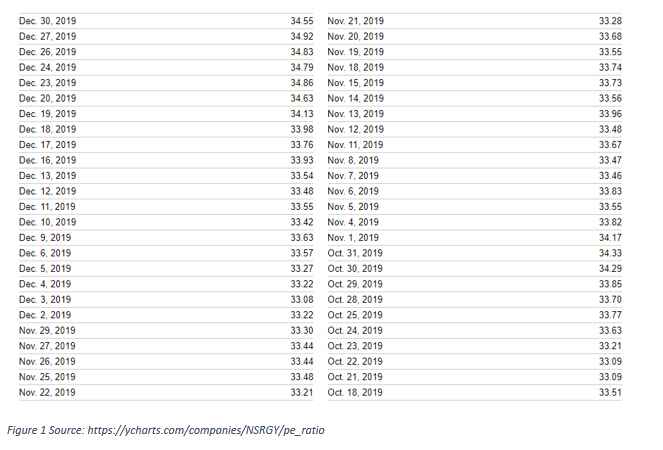
We began this article with a quote “When the going gets tough, the tough buy Nestlé.” Nestle and other similar firms are believed to be a safe bet because, with a whole wide range of their products, they have little chances to fail. Check their PE ratio from December last year:
Trivia:
S&P 500 PE ratio reached a maximum of 123.73 in May 2009.
In the aftermath of the 2008 recession, FMCG companies’ stocks were selling at a better price than technology companies.
Technology companies usually have a PE ratio of around 20 and textile manufacturers show a PE ratio of around 8.
The 1970s saw a boom in a group of 50 stocks and they were hailed as Nifty Fifty. Institutions purchased giant-sized stocks from these companies and PE ratio for these companies swayed between 65-92. Post-market-crash of 73/74, their PEs plunged to 9-18.
 Ratio for Stock Assessments")